Every Monday: what the homes around yours actually sold for, the price-per-square-foot trend, and a plain verdict on whether this is your window.
Not a Zestimate. Not a realtor's opinion. The county's own closed sales, read the week they are recorded.
Why this exists
Owners who are thinking about selling check the listing sites every few weeks and get a number that is a month stale and a model's guess. What actually decides your price is the last handful of closed sales on streets like yours — and those hit the county record days after closing, weeks before they show up anywhere else.
Money changes hands. Nothing is public yet.
Price, parties, property, deed type. This is what we read — every week, for your address.
By then you've already had two Monday reports and a verdict.
Three steps
We pull your home's beds, baths, living area, year built and last recorded sale from the county file. You confirm what you paid — that becomes your basis.
Each week we read every closed sale in your ZIP, keep the ones that compare to yours — same kind of house, similar size and age, arms-length deed — and drop the rest.
New comps with $/sqft against your basis, the month-over-month trend, a chart, two paragraphs of plain analysis, and one verdict at the top.
The verdict
Three signals, computed the same way every week from the closed sales alone: where recent sales sit against the 12-month baseline, the direction of the 24-month trend line, and where the latest month lands against your own basis. The verdict is one of four words.
Verdicts describe the closed-sale record for your comp set. They are not an appraisal, not a listing recommendation, and never use a figure that isn't in the table below them.
Sample report
A 4-bed, 2.5-bath, 2,400 sqft home in Sanford, FL 32771, bought April 2026. Every number below is from the Seminole County property appraiser's file as of 2026-09-05. Only the subject's street address is withheld.
| Sold | Address | Subdivision | Price | Sqft | $/sqft | vs $214 | Bd/Ba | Built | Deed |
|---|---|---|---|---|---|---|---|---|---|
| 2026-08-18 | 4667 Redmond Pl | Oregon Trace | $445,000 | 2,042 | $218 | ▲ +$4 | 3/2 | 2003 | Warranty Deed |
| 2026-08-07 | 257 Venetian Bay Cir | Venetian Bay | $445,000 | 1,974 | $225 | ▲ +$11 | 4/2 | 2004 | Warranty Deed |
| 2026-08-05 | 1469 Stargazer Ter | Retreat At Wekiva | $490,000 | 2,268 | $216 | ▲ +$2 | 4/3 | 2002 | Warranty Deed |
| 2026-07-29 | 304 Still Forest Ter | Tall Trees (subject's own) | $710,000 | 2,746 | $259 | ▲ +$45 | 5/3 | 1994 | Warranty Deed |
| 2026-07-29 | 4750 Cains Wren Trl | Preserve At Astor Farms | $597,000 | 2,376 | $251 | ▲ +$37 | 3/3 | 2003 | Warranty Deed |
| 2026-07-23 | 4771 Cains Wren Trl | Preserve At Astor Farms | $578,000 | 2,833 | $204 | ▼ −$10 | 4/3 | 2003 | Warranty Deed |
| 2026-07-16 | 209 Porchester Dr | Kays Landing | $575,000 | 2,533 | $227 | ▲ +$13 | 5/3 | 2005 | Warranty Deed |
| 2026-07-10 | 1834 Stargazer Ter | Retreat At Wekiva | $485,000 | 2,296 | $211 | ▼ −$3 | 3/3 | 2004 | Warranty Deed |
| 2026-07-10 | 4903 Fawn Ridge Pl | Lake Forest | $575,000 | 2,334 | $246 | ▲ +$32 | 4/3 | 2001 | Warranty Deed |
| 2026-07-09 | 312 Kimberly Ct | Shadow Lake Woods | $510,000 | 2,597 | $196 | ▼ −$18 | 4/3 | 1985 | Warranty Deed |
| 2026-07-06 | 110 Calabria Springs Cv | Calabria Cove | $535,000 | 2,556 | $209 | ▼ −$5 | 5/3.5 | 2002 | Warranty Deed |
| 2026-06-18 | 111 Carmel Bay Dr | Monterey Oaks | $495,000 | 2,170 | $228 | ▲ +$14 | 3/2.5 | 2001 | Warranty Deed |
vs $214 — each sale's $/sqft against the owner's basis; ▲ above, ▼ below. Bold row — a sale inside the subject's own subdivision, the tightest comp. Other rows match the comp bands: single-family, 3–5 bd / 2–4 ba, ≈1,900–2,900 sqft, built ≈1985–2010. Nominal, multi-parcel, quitclaim, tax and certificate-of-title deeds are filtered out. Source: Seminole County CAMA.
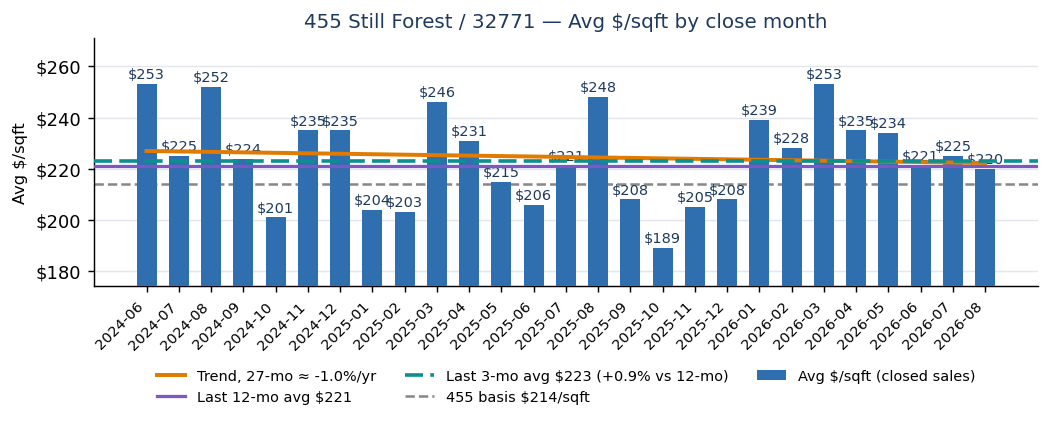
| Month (close) | Sales | Avg $/sqft | vs basis | MoM Δ | Own subdivision |
|---|---|---|---|---|---|
| 2026-03 | 4 | $253 | ▲ +$39 | ▲ +$25 | — |
| 2026-04 | 3 | $235 | ▲ +$21 | ▼ −$18 | — |
| 2026-05 | 6 | $234 | ▲ +$20 | ▼ −$1 | $267 (n=1) |
| 2026-06 | 7 | $221 | ▲ +$7 | ▼ −$13 | $242 (n=1) |
| 2026-07 | 8 | $225 | ▲ +$11 | ▲ +$4 | $259 (n=1) |
| 2026-08 | 3 | $220 | ▲ +$6 | ▼ −$5 | — |
One new sale cleared the comp bands this week: 4667 Redmond Pl in Oregon Trace at $445,000, $218/sqft — $4 above your basis, on a smaller 3/2 house. The tightest recent comp is still the July sale inside your own subdivision at $710,000 ($259/sqft) on a larger 5/3; it continues to anchor the top of the range, but a single sale is not a trend.
Month over month, August averaged $220/sqft on three sales, down $5 from July and $6 above your $214 basis. The trailing three months ($223, n=18) sit +0.9% over the trailing twelve ($221, n=53) — recent sales are running at the baseline, not above it. The full 27-month trend line annualizes to −1.0%/yr: flat. Nothing in this week's record argues for listing now; the report will flag the week the 3-month average breaks meaningfully above the 12-month line.
Figures are deterministic county data. The analysis paragraphs are drafted from those figures and may not introduce any number that isn't in the tables. Report generated 2026-09-05.
Pricing
Watch one address, get the Monday report, cancel whenever. Membership and pricing are published when the first counties switch on — no charge before the county confirms your parcel.
 TellMeWhenToSell